
Welcome to the fascinating world of data! Imagine you’ve just received a massive box of puzzle pieces. Sounds exciting, right? But what if some pieces are dirty, damaged, or don’t belong to your puzzle at all? Trying to complete your picture without sorting these out would be like trying to drive a car with fogged-up windows—risky and unclear. That’s exactly why data cleaning and preprocessing is your windshield wiper, clearing the view so you can make smart data-driven decisions.
If you’ve ever wondered what it takes to turn messy data into reliable insights, you’re in the right place. In this guide, we’ll walk you through the essentials of data cleaning and preprocessing, why it’s crucial, and how you can do it step by step with practical examples, even if you’re just starting out. Let’s dive in!
Why Data Quality Matters: The Foundation of Accurate Analysis
Data is like the gasoline that powers your car—and if the gas is contaminated, your engine sputters. The same goes for data analysis. Dirty or incomplete data can throw off your results and lead you down the wrong path. Studies show that businesses lose an average of 12% of their revenue due to poor data quality. That’s a big price to pay!
When you focus on data cleaning and preprocessing, you’re laying a rock-solid foundation. Good quality data means your decisions, predictions, and strategies are based on facts, not fiction. Whether you’re analyzing sales figures or customer feedback, a clean dataset ensures you’re getting the true picture.
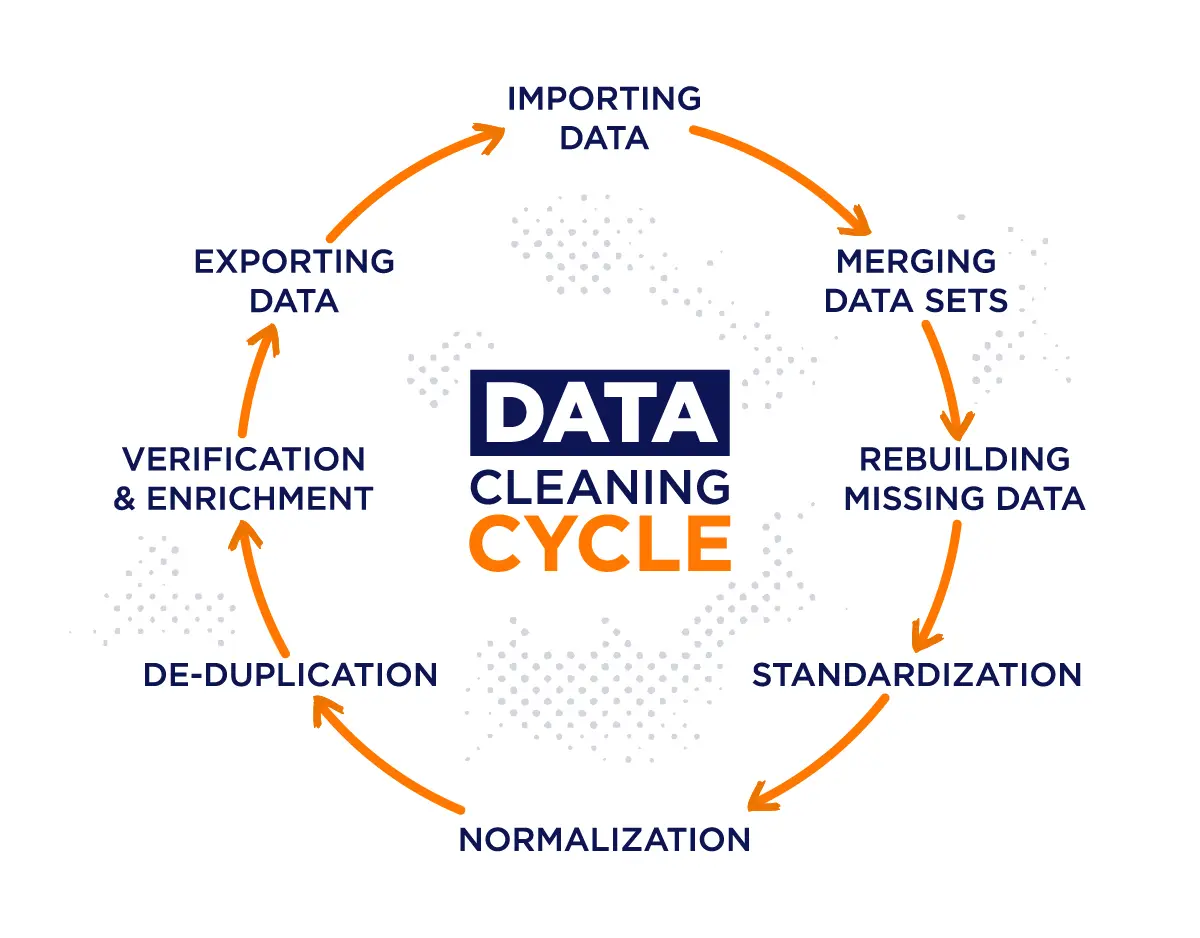
Understanding the Data Science Pipeline: Where Cleaning and Preprocessing Fit In
Think of the data science process as baking a cake. First, you gather ingredients (data acquisition), then you prep and mix them (cleaning and preprocessing), bake (modeling), and finally enjoy the cake (insights). Without the right preparation, that cake could end up flat or burnt.
Data cleaning and preprocessing come right after you collect your raw data and before any serious analysis. They make the data ready—removing noise, filling gaps, and formatting everything nicely so your algorithms can do their magic without tripping over mistakes.
Common Challenges with Raw Data: Errors, Inconsistencies, and Missing Values
Raw data is often messy—like a teenager’s bedroom before a clean-up! Some common headaches you might face include:
- Errors: Typos, misplaced entries, or data entered in the wrong format.
- Inconsistencies: Different ways of writing the same thing, e.g., “NY” vs. “New York.”
- Missing Values: Blank spaces where data wasn’t captured.
If you try to analyze data riddled with these issues, it’s like trying to read a blurry map—you’ll probably end up lost.
The Fundamentals of Data Cleaning
Spotting the Red Flags: How to Identify Erroneous Entries and Duplicates

First, you need to play detective. Go through your data and spot any weird values that don’t make sense. Maybe someone’s age is listed as 200, or a phone number has letters instead of digits. These are your red flags.
Duplicates are like hearing the same gossip twice — pointless and misleading. Identifying duplicate records ensures that each data point is unique, which makes your analysis trustworthy.
Removing Duplicate Records: Ensuring Unique and Reliable Data
Once duplicates are found, you remove them—this can be done easily with tools like Python’s Pandas library using drop_duplicates(). This step prevents double-counting and keeps your insights sharp.
Handling Missing Values: Strategies for Imputation, Removal, and Beyond
Missing data is a challenge, but you have options:
- Imputation: Fill in missing values using averages or similar entries. For example, if a few ages are missing, you could use the average age from the dataset.
- Removal: If too many values in a row or column are missing, it might be better to drop those.
- Flagging: Sometimes, you create a new feature indicating whether data was missing to track its impact.
Standardizing Data Entries: Cleaning Names, Phone Numbers, and Addresses for Consistency
Imagine sending an invitation addressed to “Mr. John Doe” and “J. Doe” in the same neighborhood—that would confuse the postman! Standardizing data entries means formatting text so everything looks consistent: removing extra spaces, fixing typos, and ensuring phone numbers follow the same pattern.
When to Drop Columns: Recognizing and Removing Irrelevant or Redundant Data
Not every piece of data is your friend. Columns like “Ticket Number” or “Nickname” might not serve your analysis. Dropping these irrelevant or redundant columns declutters your dataset and hones your focus where it matters.
Essential Data Preprocessing Techniques
Data Scaling Demystified: How and Why to Transform Numerical Values
Imagine comparing apples to oranges—numbers measured on different scales can skew things. Say you have age values ranging from 1 to 100 and income values from 10,000 to 1,000,000. If left as-is, the income will overshadow age in calculations, distorting results.
Scaling transforms these numbers to a similar range, typically between 0 and 1. This levels the playing field. You can do this simply in Python with tools like MinMaxScaler.
Data Normalization: Balancing Feature Influence Across Different Ranges
Normalization adjusts your data so each feature, whether it’s height or spending, contributes equally. Methods like L1 or L2 normalization shrink or spread values as needed. This is especially handy for machine learning, where feature balance is critical.
Creating New Features: Adding Value Through Derived Columns
Sometimes, preprocessing means not just cleaning but enriching your data. For example, from a “Fare” column, you might create a scaled version or categorize fares as “Low,” “Medium,” or “High.” These new features often uncover hidden patterns.
Practical Tools to Streamline Preprocessing: Introducing Python Libraries like MinMaxScaler
Speed up your workflow using Python libraries. The MinMaxScaler from scikit-learn automates scaling, while Pandas offers methods for handling missing data, duplicates, and more. These tools turn tedious chores into simple function calls, making you look like a wizard.
Step-by-Step Practical Examples Using Real Datasets
Importing Data into Pandas: Setting Up Your Workspace for Success
Start with your toolkit ready. Import Pandas in Python:
					import pandas as pd
data = pd.read_csv('your-dataset.csv')
Now, you’re ready to explore and clean.
Inspecting and Cleaning the Titanic Dataset: A Hands-On Approach
Inspecting and cleaning the Titanic dataset is an excellent hands-on exercise for mastering data cleaning and preprocessing techniques. When you first load this dataset, you often find it peppered with missing values, duplicates, and columns that may not serve your analysis goals. Your initial step is to explore the data thoroughly—check for null or missing entries especially in critical fields like “Age,” “Cabin,” and “Embarked.”
For instance, many passenger ages may be missing, and deciding how to handle these gaps is key. You might choose to fill missing ages with the average or median age, or even use more advanced techniques like predicting missing values based on other variables.
Next, look out for duplicates or erroneous entries that could mislead your analysis. Dropping duplicate rows using Python’s Pandas drop_duplicates() function ensures each passenger’s info is unique, enhancing data integrity. Also, scrutinize columns such as “Ticket” or “Cabin” — if they contain many missing values or little predictive power, it’s often best to drop them entirely to reduce noise.
Standardizing data entries is equally important. For example, the “Embarked” column may contain inconsistent labels like “S,” “Southampton,” or blank spaces. Matching these ensures your models interpret the data correctly. By thoroughly inspecting and cleaning the Titanic dataset, you transform raw, messy data into a reliable, polished asset ready for insightful analysis.
Visualizing the Impact of Data Cleaning: Before and After Comparisons
Visualizing the impact of data cleaning through before and after comparisons is like watching a messy room transform into a tidy, organized space—it clearly shows the value of your efforts. Before cleaning, you might plot the distribution of a dataset’s key features and notice irregularities such as spikes from missing values, outliers, or duplicated data points that distort the visuals. For example, a histogram of passenger ages in the Titanic dataset may have gaps or clusters caused by missing or erroneous entries.
After cleaning, the same visualizations should reflect a smoother and more accurate representation of the data. Missing values filled with appropriate estimates, duplicates removed, and inconsistent entries corrected all help to produce clearer, more trustworthy charts and graphs. Bar charts, box plots, or scatter plots can highlight these improvements visually.
This side-by-side comparison is not only satisfying but also essential for confirming that your preprocessing steps are effective. It provides evidence that the dataset is now more representative of reality, which is critical before feeding data into predictive models. Visualization tools like Matplotlib or Seaborn in Python make it easy to generate these comparisons, giving you a powerful way to communicate your data cleaning success to stakeholders or team members. Ultimately, this clarity helps build confidence in the analysis and the decisions based upon it.
Working with Wine Quality and Breast Cancer Datasets: Diverse Use Cases for Practice
Working with datasets like Wine Quality and Breast Cancer offers you diverse, real-world scenarios to practice data cleaning and preprocessing techniques. Each dataset challenges you with unique data types, missing values, and scaling needs, sharpening your skills for various industries.
Take the Wine Quality dataset, for example. This dataset includes chemical properties like acidity, sugar content, and pH levels—numerical features that often require scaling to ensure fair comparison. Companies like Constellation Brands, a leading beverage company, rely on such data to maintain quality control and improve wine formulations. Proper preprocessing here enables accurate modeling to predict wine quality, helping vintners make data-driven adjustments to crafting their products.
On the healthcare front, the Breast Cancer dataset includes clinical measurements and test results that require meticulous cleaning. Hospitals and biotech firms such as Roche Diagnostics harness such data to develop diagnostic tools and improve patient outcomes. Handling missing test results, standardizing numerical ranges, and creating new features are critical preprocessing steps to empower machine learning models that aid early cancer detection.
By working through these datasets, you get hands-on experience solving problems that real companies face daily—preparing messy data, enhancing features, and ensuring quality input for predictive analytics. Such skills are invaluable whether you’re optimizing product quality or improving life-saving healthcare decisions.
Best Practices and Tips for Effective Data Cleaning and Preprocessing
Keeping Your Data Organized: Index Resetting and Saving Cleaned Datasets
After cleaning, reset indexes so your data is neat and orderly:
data.reset_index(drop=True, inplace=True)
Always save your cleaned data separately to preserve your work.
Balancing Automation and Manual Checks: When to Trust Code vs. Human Insight
Automation is a huge time-saver but don’t throw human judgment out the window. Some issues require an experienced eye—like spotting outliers that are legitimately rare, not errors.
Preparing for Large Datasets: Scaling Your Cleaning Process Efficiently
Big data calls for scalable solutions. Use batch processing, cloud tools, or parallel processing to clean large volumes without breaking a sweat.
The Role of Documentation: Tracking Changes for Reproducibility and Collaboration
Keep a detailed log of cleaning steps. Not only does this help you replicate your work, but it also makes collaborating with teammates smoother.
Conclusion
In the grand scheme, data cleaning and preprocessing is like tuning an instrument before a concert. Without it, your performance—your analysis—falls flat. Clean data drives smarter decisions, sharper predictions, and business success.
Don’t be overwhelmed. Start small, practice often, and build confidence by working with well-known datasets like Titanic or Wine Quality. With time, you’ll master advanced techniques and open doors to machine learning and AI.
At MN Service Providers, we believe every great insight starts with spotless data. Ready to get your hands dirty and polish your datasets? Your journey to becoming a data pro starts today!
References
- Your Third Data Science Class – Data Cleaning and Preprocessing 1. https://www.youtube.com/watch?v=ylhwP6wFEag
- Data Cleaning in Pandas | Python Pandas Tutorials by Alex The Analyst. https://www.youtube.com/watch?v=bDhvCp3_lYw
- Scikit-learn documentation on MinMaxScaler. https://scikit-learn.org/stable/modules/generated/sklearn.preprocessing.MinMaxScaler.html
- Titanic Dataset – Kaggle. https://www.kaggle.com/c/titanic
- Wine Quality Dataset – UCI Machine Learning Repository. https://archive.ics.uci.edu/ml/datasets/Wine+Quality
- Breast Cancer Wisconsin Dataset – UCI Machine Learning Repository. https://archive.ics.uci.edu/ml/datasets/Breast+Cancer+Wisconsin+(Diagnostic)
Frequently Asked Questions (FAQ)
Data cleaning and preprocessing is the process of fixing and organizing raw data so that it is ready for analysis. It involves removing mistakes, filling in missing information, and making the data consistent. This step is very important because clean data helps computers and people make better decisions. Without this process, data can be confusing or incorrect. Simply put, it prepares data to be useful and easy to work with.
The five major steps of data preprocessing include data collection, data cleaning, data integration, data transformation, and data reduction. First, you gather the data you need. Then, in data cleaning, you fix errors and remove bad data. Next, data integration combines data from different sources. After that, data transformation changes data into a useful format. Finally, data reduction makes the data easier to analyze by removing unnecessary details.
There are several types of data cleaning, such as removing duplicate records, fixing spelling mistakes, handling missing values, and correcting errors. Sometimes data may have extra spaces or special characters, which need to be cleaned too. Another type is standardizing data, like making all dates look the same. These types help make sure the data is accurate and easy to work with.
The four stages of data processing are input, processing, output, and storage. First, data is collected and entered (input). Then, it is organized and calculated (processing). After processing, the results are shown or sent to others (output). Finally, the data and results are saved for future use (storage). These steps help turn raw data into useful information.
To handle missing data, you can either fill in the gaps or remove the incomplete parts. One way is to replace missing numbers with the average or most common value. Another method is to guess the missing data using patterns from other data points. If a lot of data is missing, sometimes it’s best to remove those rows or columns. Handling missing data carefully helps keep your analysis accurate.
Melvin C Varghese is an author with more than 8 years of expertise in DevOps, SEO and SEM. His portfolio blogs include a Digital Marketing blog at https://melvincv.com/blog/ and a DevOps blog at https://blog.melvincv.com/. He is married with 2 small kids and is a simple person who eats, sleeps, works and plays. He loves music, comedy movies and the occasional video game.